따릉이 대여량 예측 AI 연습하기
따릉이 대여량 예측 AI 연습하기
https://dacon.io/competitions/official/235837/overview/description
dacon에서 예전에 진행한 따릉이 대여량 예측 AI 대회로 모델 연습을 진행하였다
데이터 구조
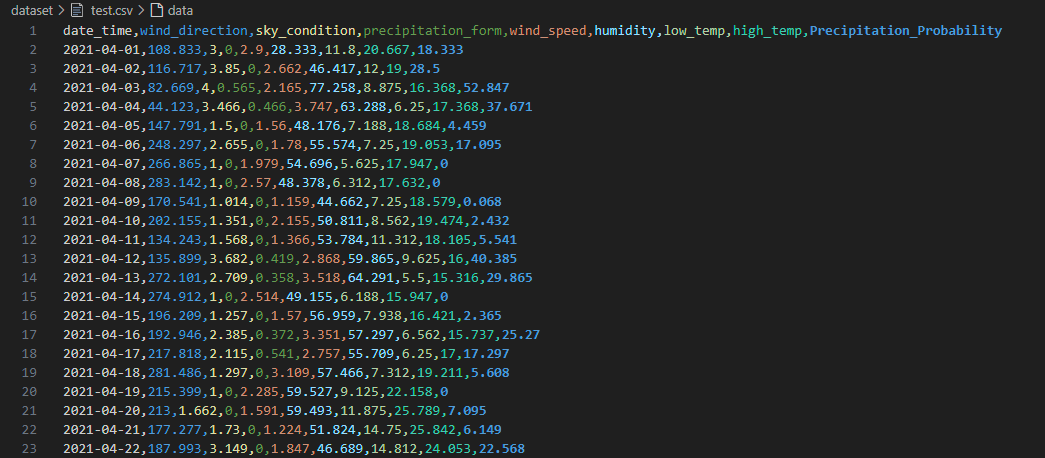
Train Data
- date_time : 일별 날짜
- wind_direction: 풍향 (degree)
- sky_condition : 하늘 상태 (하단 설명 참조)
- precipitation_form : 강수 형태 (하단 설명 참조)
- wind_speed : 풍속 (m/s)
- humidity : 습도 (%)
- low_temp : 최저 기온 ( `C)
- high_temp : 최고 기온 ( `C)
- Precipitation_Probability : 강수 확률 (%)
- number_of_rentals : 따릉이 대여량
Test Data
- number_of_rentals 가 없다
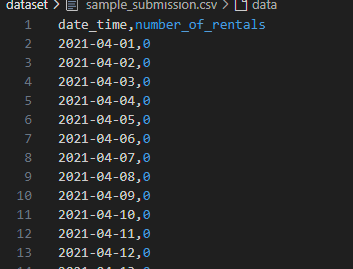
Submit
- 제출 파일 형식
기본 코드
- https://dacon.io/competitions/official/235837/codeshare/3686?page=1&dtype=recent
- 제공하는 baseline 코드를 참고해서 구현
1
2
3
4
5
6
7
8
9
10
11
12
13
14
15
16
17
18
19
20
21
22
23
24
25
26
27
28
29
30
31
32
33
34
35
36
37
38
39
40
41
42
43
44
45
46
47
48
49
50
51
52
53
54
55
56
57
58
59
60
61
62
63
64
65
66
67
68
69
70
71
72
73
74
75
76
77
78
79
80
81
82
83
84
85
86
87
88
89
90
91
92
93
94
95
96
97
98
99
100
101
102
103
104
105
106
107
108
109
110
111
112
113
114
115
116
117
118
119
120
121
122
import pandas as pd
import numpy as np
import warnings
import matplotlib.pyplot as plt
from sklearn.linear_model import LinearRegression
import matplotlib

# GUI 백엔드 설정
matplotlib.use("TkAgg")
# 경고 무시
warnings.filterwarnings('ignore')

# 상수 관리 클래스
class Config:
    TRAIN_PATH = 'dataset/train.csv'
    TEST_PATH = 'dataset/test.csv'
    OUTPUT_PATH = 'submission.csv'
    FIGURE_SIZE = (20, 10)

# 결측치 확인 함수
def check_missing_col(dataframe):
    counted_missing_col = 0
    for i, col in enumerate(dataframe.columns):
        missing_values = sum(dataframe[col].isna())
        is_missing = True if missing_values >= 1 else False
        if is_missing:
            counted_missing_col += 1
            print(f'결측치가 있는 컬럼은: {col}입니다')
            print(f'총 {missing_values}개의 결측치가 존재합니다.')
        if i == len(dataframe.columns) - 1 and counted_missing_col == 0:
            print('결측치가 존재하지 않습니다')

# 날짜 분리 함수
def seperate_datetime(dataframe):
    year, month, day = [], [], []
    for date in dataframe.date_time:
        year_point, month_point, day_point = date.split('-')
        year.append(int(year_point))
        month.append(int(month_point))
        day.append(int(day_point))
    return year, month, day

# 데이터 전처리 함수
def preprocess_data(dataframe):
    # 날짜 분리
    year, month, day = seperate_datetime(dataframe)
    dataframe['year'] = year
    dataframe['month'] = month
    dataframe['day'] = day
    return dataframe

# 모델 학습 함수
def train_model(X, y):
    model = LinearRegression()
    model.fit(X, y)
    return model

# NMAE 계산 함수
def calculate_nmae(y_true, y_pred):
    return np.mean(np.abs(y_pred - y_true) / y_true)

# 시각화 함수
def visualize_predictions(y_true, y_pred):
    plt.figure(figsize=Config.FIGURE_SIZE)
    plt.plot(y_pred, label='Prediction')
    plt.plot(y_true, label='Real')
    plt.legend(fontsize=20)
    plt.title("Prediction vs Real")
    plt.show()

# 제출 파일 생성 함수
def create_submission_file(test_predictions, test_df, output_path):
    submission_df = pd.DataFrame({
        'date_time': test_df['date_time'],
        'number_of_rentals': test_predictions
    })
    submission_df.to_csv(output_path, index=False)

# main 함수 정의
def main():
    # 데이터 로드
    train_df = pd.read_csv(Config.TRAIN_PATH)
    test_df = pd.read_csv(Config.TEST_PATH)

    # Train 데이터 결측치 확인
    check_missing_col(train_df)

    # Train 데이터 전처리
    train_df = preprocess_data(train_df)

    # Train 데이터 X, y 분리
    X_train = train_df.drop(['date_time', 'number_of_rentals'], axis=1)
    y_train = train_df['number_of_rentals']

    # 모델 학습
    model = train_model(X_train, y_train)

    # Train 데이터 예측 및 NMAE 계산
    y_train_pred = model.predict(X_train)
    nmae = calculate_nmae(y_train, y_train_pred)
    print(f"모델 NMAE: {nmae}")

    # Test 데이터 결측치 확인
    check_missing_col(test_df)

    # Test 데이터 전처리
    test_df = preprocess_data(test_df)
    X_test = test_df.drop(['date_time'], axis=1)

    # Test 데이터 예측
    test_predictions = model.predict(X_test)

    # 제출 파일 생성
    create_submission_file(test_predictions, test_df, Config.OUTPUT_PATH)

    # 예측 결과 시각화
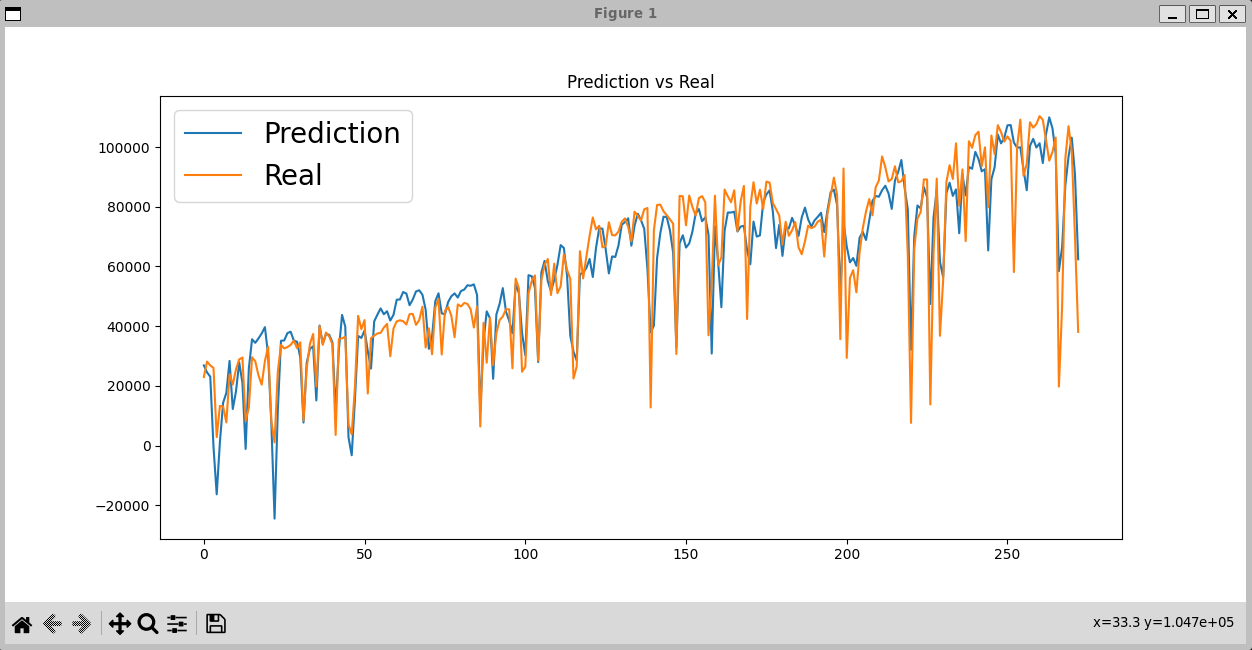
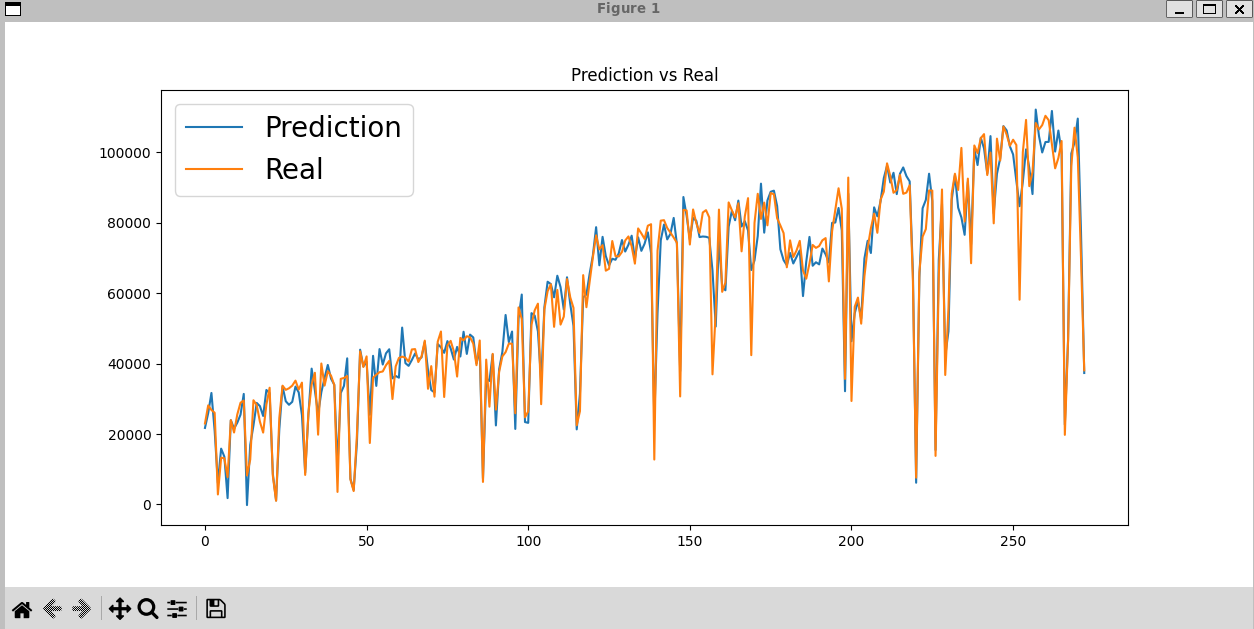
    visualize_predictions(y_train, y_train_pred)

# main 함수 실행
if __name__ == "__main__":
    main()
결과
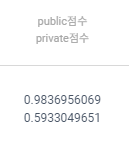
- 오차율 : 약 30%
- 점수가 높은 편은 아니다
Feature Engineering
- https://dacon.io/competitions/official/235837/codeshare/3687?page=1&dtype=recent
- 2번째 baseline 참고하여 구현
feature_engineering_human- 요일 정보, 온도 차, 땀 정보, 추운 날씨 정보를 추가
feature_engineering_computer- 모든 변수의 곱과 제곱을 새로운 feature로 추가
1
2
3
4
5
6
7
8
9
10
11
12
13
14
15
16
17
18
19
20
21
22
23
24
25
26
27
28
29
30
31
32
33
34
35
36
37
38
39
40
41
42
43
44
45
46
47
48
49
50
51
52
53
54
55
56
57
58
59
60
61
62
63
64
65
66
67
68
69
70
71
72
73
74
75
76
77
78
79
80
81
82
83
84
85
86
87
88
89
90
91
92
93
94
95
96
97
98
99
100
101
102
103
104
105
106
107
108
109
110
111
112
113
114
115
116
117
118
119
120
121
122
123
124
125
126
127
128
129
130
131
132
133
134
135
136
137
138
139
140
141
import pandas as pd
import numpy as np
import warnings
import matplotlib.pyplot as plt
from sklearn.linear_model import LinearRegression
from sklearn.preprocessing import LabelEncoder
import matplotlib

# GUI 백엔드 설정
matplotlib.use("TkAgg")
# 경고 무시
warnings.filterwarnings('ignore')

# 상수 관리 클래스
class Config:
    TRAIN_PATH = 'dataset/train.csv'
    TEST_PATH = 'dataset/test.csv'
    OUTPUT_PATH = 'submission.csv'
    FIGURE_SIZE = (20, 10)

# 결측치 확인 함수
def check_missing_col(dataframe):
    for col in dataframe.columns:
        missing_values = dataframe[col].isna().sum()
        if missing_values > 0:
            print(f"결측치가 있는 컬럼: {col}, 결측치 수: {missing_values}")
    print("결측치 확인 완료.")

# 날짜 분리 함수
def seperate_datetime(dataframe):
    year, month, day = [], [], []
    for date in dataframe.date_time:
        year_point, month_point, day_point = date.split('-')
        year.append(int(year_point))
        month.append(int(month_point))
        day.append(int(day_point))
    return year, month, day

# Feature Engineering by Human
def feature_engineering_human(X, original_df):
    # 요일 정보 추가
    week_day = pd.to_datetime(original_df['date_time']).dt.day_name()
    le = LabelEncoder()
    le.fit(week_day)
    X['week_day'] = le.transform(week_day)

    # 추가 Feature
    X['temp_diff_info'] = X['high_temp'] - X['low_temp']
    X['sweat_info'] = X['high_temp'] * X['humidity']
    X['cold_info'] = X['low_temp'] * X['wind_speed']
    return X

# Feature Engineering by Computer
def feature_engineering_computer(X):
    col_list = X.columns
    for i in range(len(col_list)):
        for j in range(i, len(col_list)):
            X[f'{col_list[i]}*{col_list[j]}'] = X[col_list[i]] * X[col_list[j]]
    return X

# 데이터 전처리 함수
def preprocess_data(dataframe):
    year, month, day = seperate_datetime(dataframe)
    dataframe['year'] = year
    dataframe['month'] = month
    dataframe['day'] = day
    return dataframe

# 모델 학습 함수
def train_model(X, y):
    model = LinearRegression()
    model.fit(X, y)
    return model

# NMAE 계산 함수
def calculate_nmae(y_true, y_pred):
    return np.mean(np.abs(y_pred - y_true) / y_true)

# 시각화 함수
def visualize_predictions(y_true, y_pred):
    plt.figure(figsize=Config.FIGURE_SIZE)
    plt.plot(y_pred, label='Prediction')
    plt.plot(y_true, label='Real')
    plt.legend(fontsize=20)
    plt.title("Prediction vs Real")
    plt.show()

# 제출 파일 생성 함수
def create_submission_file(test_predictions, test_df, output_path):
    submission_df = pd.DataFrame({
        'date_time': test_df['date_time'],
        'number_of_rentals': test_predictions
    })
    submission_df.to_csv(output_path, index=False)

# main 함수 정의
def main():
    # 데이터 로드
    train_df = pd.read_csv(Config.TRAIN_PATH)
    test_df = pd.read_csv(Config.TEST_PATH)

    # Train 데이터 결측치 확인
    check_missing_col(train_df)

    # Train 데이터 전처리
    train_df = preprocess_data(train_df)
    X_train = train_df.drop(['date_time', 'number_of_rentals'], axis=1)
    y_train = train_df['number_of_rentals']

    # Feature Engineering
    X_train = feature_engineering_human(X_train, train_df)
    X_train = feature_engineering_computer(X_train)

    # 모델 학습
    model = train_model(X_train, y_train)

    # Train 데이터 예측 및 NMAE 계산
    y_train_pred = model.predict(X_train)
    nmae = calculate_nmae(y_train, y_train_pred)
    print(f"모델 NMAE: {nmae}")

    # Test 데이터 전처리 및 Feature Engineering
    check_missing_col(test_df)
    test_df = preprocess_data(test_df)
    X_test = test_df.drop(['date_time'], axis=1)
    X_test = feature_engineering_human(X_test, test_df)
    X_test = feature_engineering_computer(X_test)

    # Test 데이터 예측
    test_predictions = model.predict(X_test)

    # 제출 파일 생성
    create_submission_file(test_predictions, test_df, Config.OUTPUT_PATH)

    # 예측 결과 시각화
    visualize_predictions(y_train, y_train_pred)

# main 함수 실행
if __name__ == "__main__":
    main()
결과
- 오차율 : 약 10%
- 무려 20% 이상 정확도가 올랐다
정리
- 결측치
- 데이터셋에서 특정 변수나 항목의 값이 비어 있는 상태
- 유형
- MCAR (Missing Completely at Random)
- 데이터의 결측이 완전히 랜덤으로 발생하며, 특정 변수나 패턴과 관련이 없음
- 예: 센서가 고장 나서 특정 시간대의 데이터가 누락됨
- MAR (Missing at Random)
- 결측이 특정 변수와 관련이 있지만, 그 변수 자체와는 무관
- 예: 사용자가 나이 데이터 제공을 꺼릴 수 있지만, 교육 수준과는 관련이 있을 수 있음
- MNAR (Missing Not at Random)
- 결측이 데이터 자체의 특성과 연관
- 예: 높은 수입을 가진 사람들이 수입을 공개하지 않으려 함
- MCAR (Missing Completely at Random)
- 해결법
- 결측치를 채우기 위해 평균, 중앙값, 최빈값 등을 사용할 수 있음
- 결측치가 많은 경우 해당 열이나 행을 제거
- 예측 모델을 사용하여 결측치를 보완
- Feature Engineering
- Feature Engineering by Human
- 도메인 지식을 활용해 데이터를 해석하기 쉽고 모델 성능을 높일 수 있는 feature를 생성
- Feature Engineering by Computer
- 자동으로 feature를 생성하여 모델이 학습할 수 있는 정보를 확장
- Feature Engineering by Human
- Feature Engineering by Computer에서 feature 자기 자신의 제곱과 두 feature 간의 곱이라는 새로운 feature를 추가하는 이유
- 목적
- 비선형 관계 포착: 기존 feature가 단순히 선형적 관계를 설명하지 못하는 경우, 제곱이나 곱을 통해 비선형 관계를 반영
- 설명력 강화: 모델이 더 다양한 패턴을 학습하도록 돕기 위해 feature를 확장
- 효과
- 날씨와 대여량 사이의 관계가 선형적이지 않다면, 추가된 제곱 혹은 곱 feature가 이를 보완할 가능성이 있음
- 주의점
- 과적합(Overfitting): 생성된 feature가 너무 많아져 모델이 훈련 데이터에 과적합될 가능성
- 모델 복잡도 증가: 계산량이 많아지고 해석이 어려워질 수 있음
- 이를 방지하기 위해 적절한 Feature Selection 또는 규제(Regularization) 방법을 병행할 수 있음
- 목적
This post is licensed under CC BY 4.0 by the author.


